How do I find out how bad the wildfire smoke is in the US?
The US EPA Fire and Smoke Map is generally the best site for most people in the US. It updates every hour and aggregates all the official EPA sensors, as well as low-cost PurpleAir sensors. It also shows active fires.
What if I don’t live in the US?
World Air Quality Index is a fantastic site that also clearly represents air quality history, but it’s not as accurate when representing low-cost air quality sensors in the US. |
What do all the colors mean?
These are generally standard colors used by the EPA, but they are as follows:
| AQI | Category name |
|---|---|
| 0 - 50 | Good |
| 51 - 100 | Moderate |
| 101 - 150 | Unhealthy for Sensitive Groups |
| 151 - 200 | Unhealthy |
| 201 - 300 | Very Unhealthy |
| 301 - 500 | Hazardous |
I generally disagree with AQI > 100 being only “unhealthy for sensitive groups”. I think prolonged exposure to it is unhealthy, full stop. In general, you should try to be in “Good” air as much as possible.
What do I do if the air is bad?
- First, if you are in a region designated for wildfire evacuation, please evacuate.
- Avoid exertion and go indoors if possible. Close your windows and doors.
- Run air filters indoor, if you are able to have them. If you have access to a commercial building with air conditioning and air filtering, consider spending time there. If you must be outside, wear N95 masks, or a respirator with N95/N99/P100 filters.
- If mainstream air filters are too expensive, you can try making them out of air filters and a box fan.
- If you don’t have enough filters for your living space, gather your family into fewer rooms in the house if possible so the air filter is filtering a smaller living space.
- If the air is really bad, consider wearing a mask on top of running a filter indoors.
- Finally, explore smoke forecasts to figure out if there are days, or even hours, where you might be more able to go outside or ventilate your house.
Can I see data even faster than the US EPA Map?
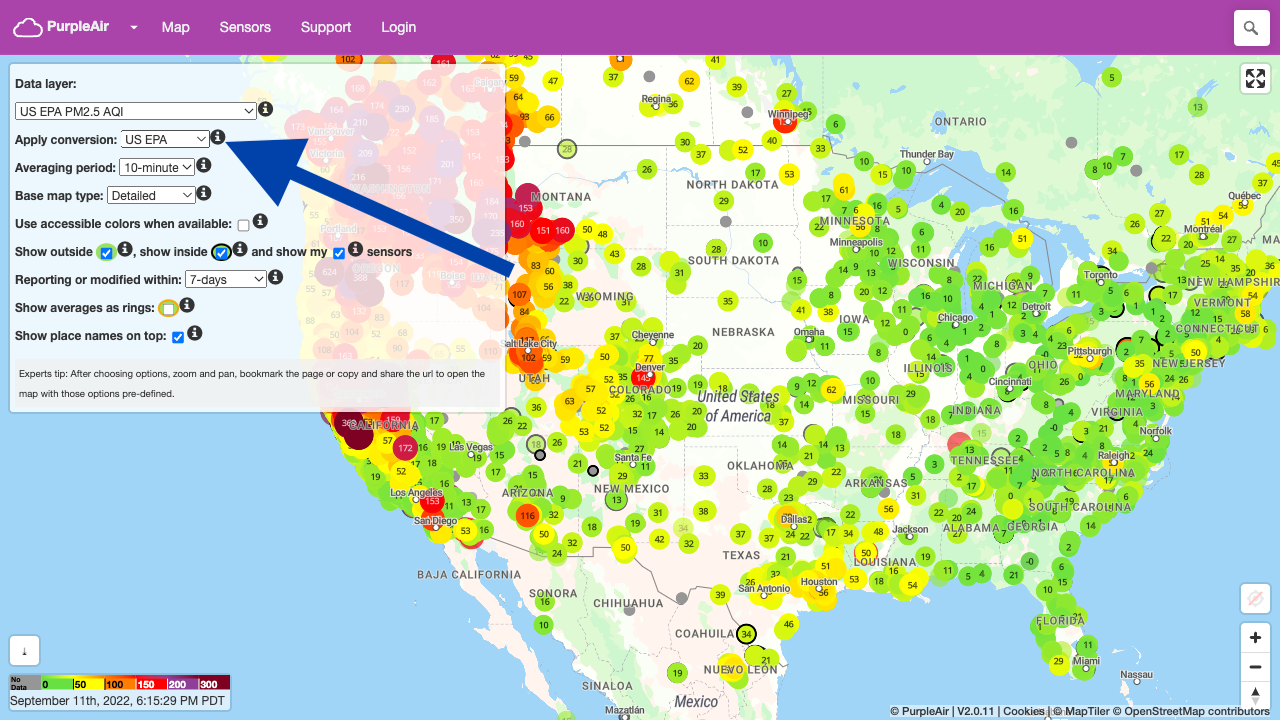 Make sure you select “Apply Conversion” –> “US EPA” PurpleAir Real-Time Map shows data from the self-installed, relatively low-cost air quality sensors. The EPA map and the Puget Sound map already contain this data, but if either loads badly on your device, or you must have faster-updating data (averaged every 10 min), this can be a good option. Before using, please open the data layer and make sure you select |
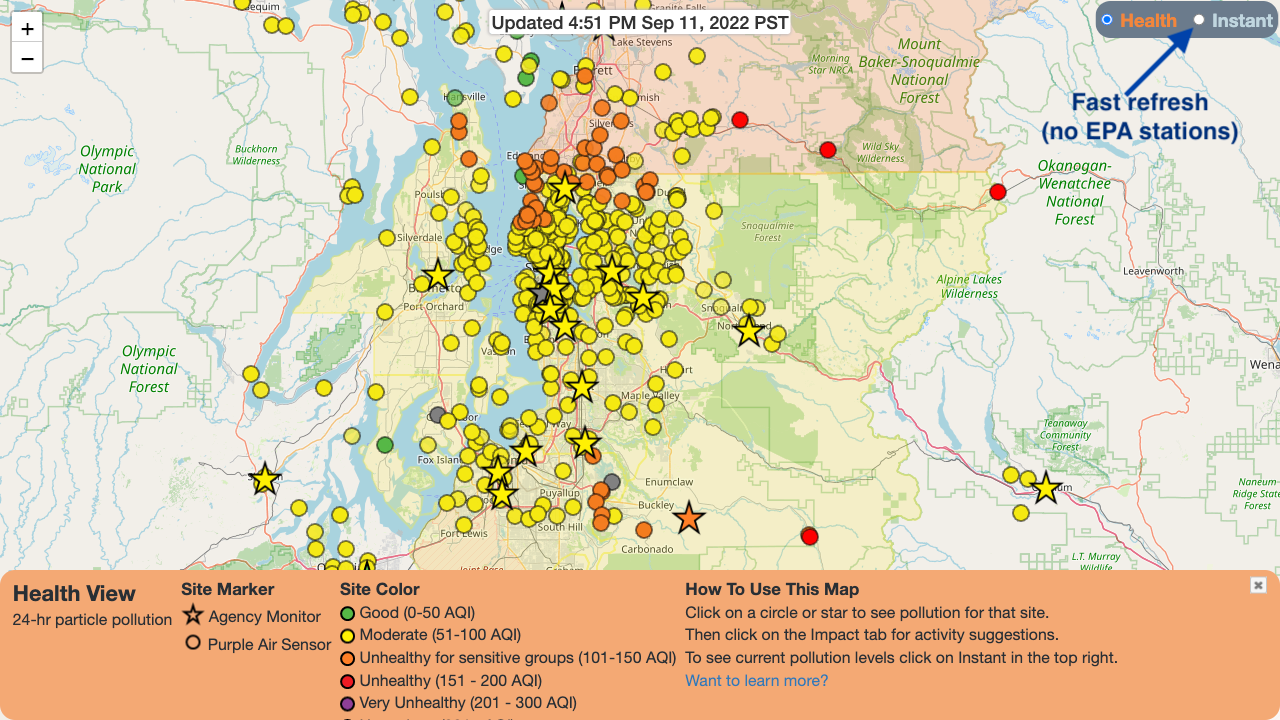
If you live in Washington state, Puget Sound Clean Air Agency hosts a map that shows hourly and real-time data, and allows a way to access a fast-refreshing version of the data. It loads faster than the EPA map. |
Where do I find future smoke forecasts?
If you live in Washington state, daily smoke forecasts are available from WA Ecology, with a general county-by-county note of the air quality over the next 5 days.
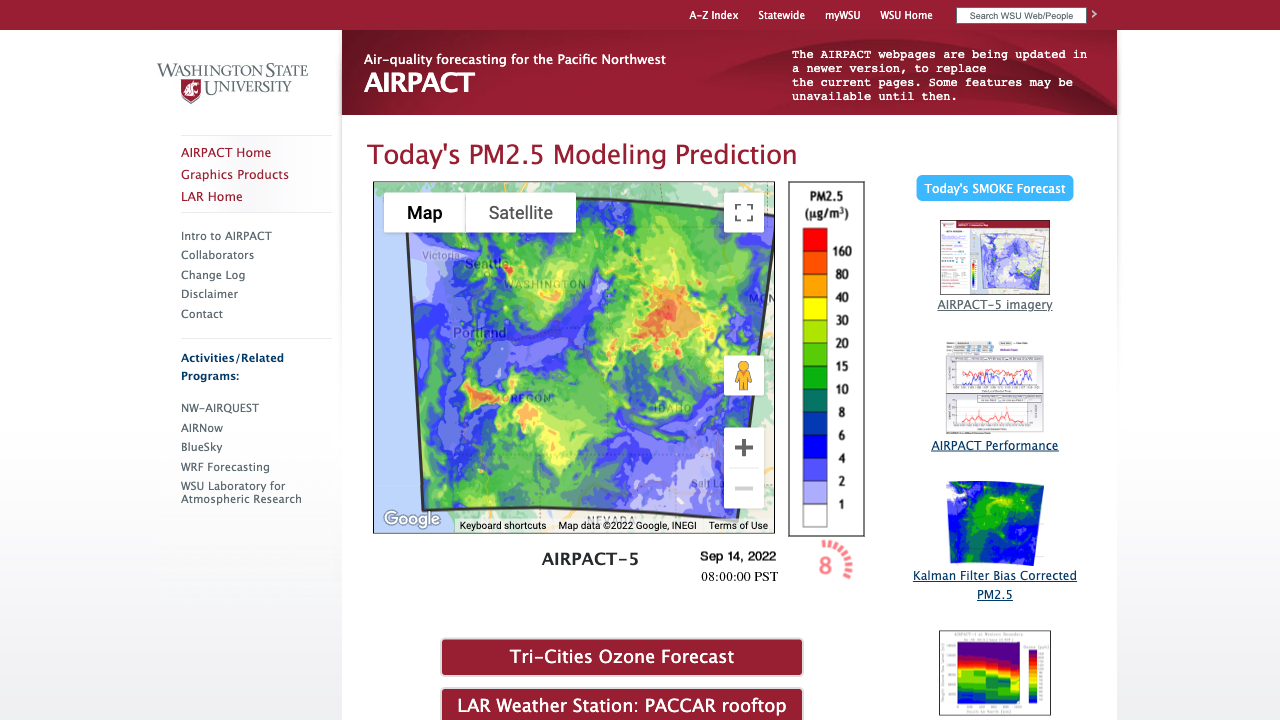
Another tool available in the Pacific Northwest is Washington State University’s AIRPACT, which can provide hour-by-hour forecasts for the next 48 hours. Note that much like weather forecasting, hourly smoke forecasting into the future can be imprecise.
Are there additional hour-by-hour forecasts for other US locations?
The US Forest Service and US National Oceanic and Atmospheric Administration runs many complex models that try to capture smoke at different times all across the country at different resolutions:
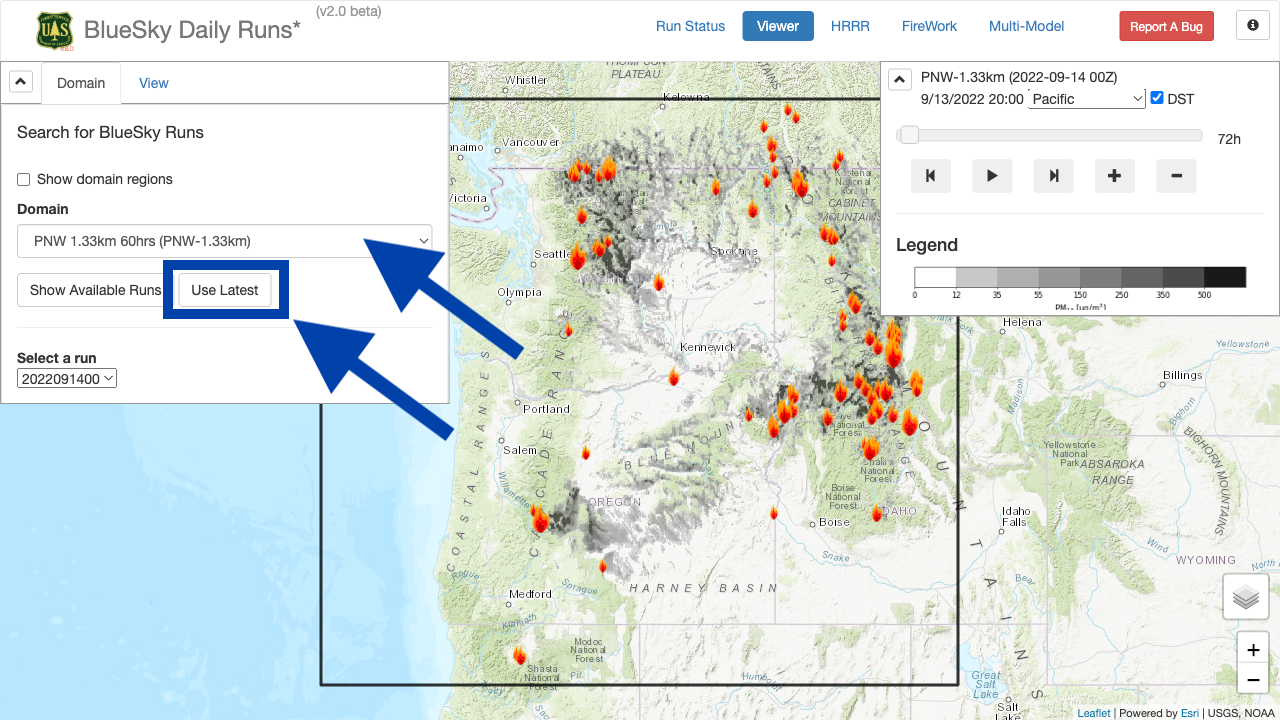 Go over to the “Viewer” tab (automatic on mobile), select the best model (see table), and press “Use latest”. Twice a day, the US Forest Service runs simulations for their BlueSky Model, in conjunction with the University of Washington. There are multiple versions of this that you can pick based on where you live.
| ||||||||
|
The US National Oceanic and Atmospheric Administration’s High Resolution Rapid Refresh (HRRR) model has a smoke component. This is even more an advanced usage product – it shows UTC time only, and you have to find the correct runs that has extended simulations. 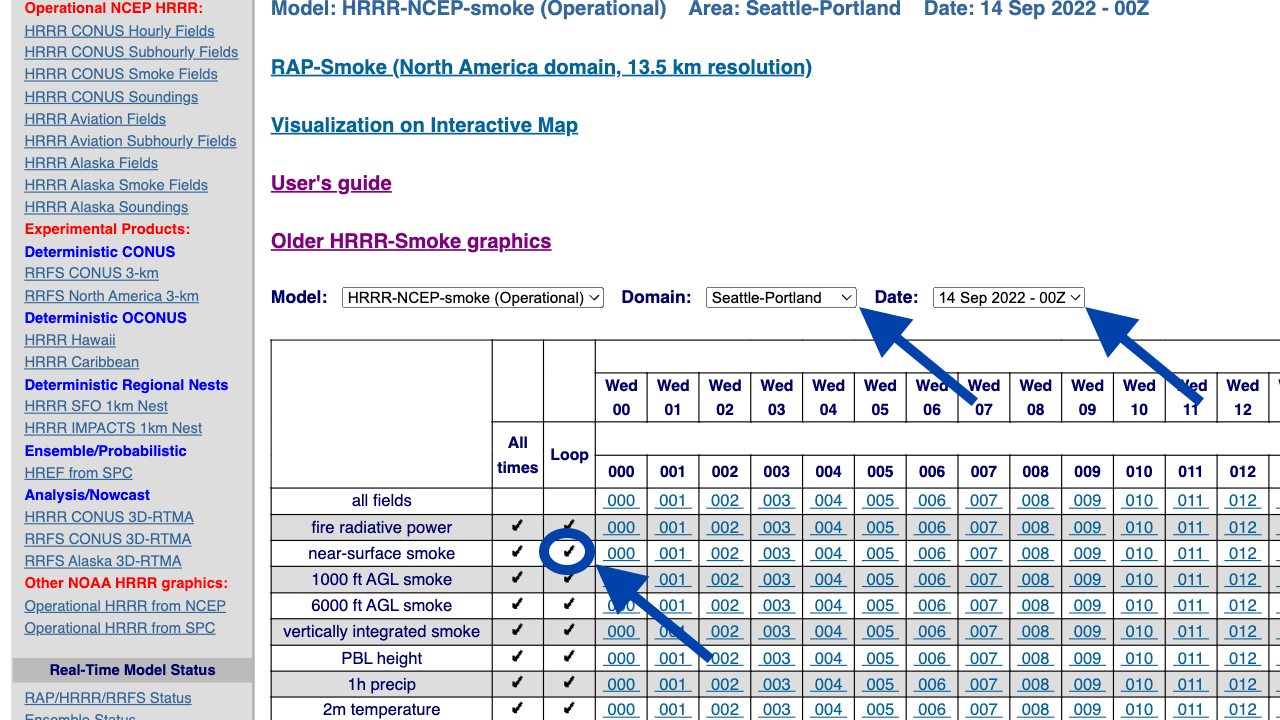
What you want to do here is:
This will play a 48-hour model prediction animation. Note that the times on are still UTC, you will have to correct to your local time. |
More technical topics
How do you get AQI from a particle counter?
First of all, if you are doing this yourself, you are probably using an inexpensive Plantower PMSx003 counter, and probably want to first correct it closer to EPA standard particle counts before doing the AQI conversion below. See the section on correction here.
The AQI Breakpoints for all major pollutants are listed here. To convert, make a piecewise linear interpolation between the breakpoints to convert PM2.5 μg/m3 to AQI units. Equation 1 on Page 21 of 40 CFR Part 58 describes an example for the linear interpolation between the designated breakpoints, but note the actual breakpoints themselves have been superceded in 2012 by the previous breakpoint page. aqicn.org has a colorful table that also describes this, but note that its last breakpoint does not describe higher particle counts.
$$I_{p} = \left(C_p - BP_{\text{Lo}}\right) \frac{I_{\text{Hi}} - I_{\text{Lo}}} {BP_{\text{Hi}} - BP_{\text{Lo}}} + I_{\text{Lo}}$$
For your convenience, here is my C snippet that converts μg/m3 to AQI:
#include <math.h>
float computeAQI(float x) {
    x = roundf(x * 10.0) / 10.0;
    if (x >= 0.0 && x < 12.1) {
        return x / 12.0 * 50.0;
    } else if (x >= 12.1 && x < 35.5) {
        return (x - 12.1) / 23.3 * 49.0 + 51.0;
    } else if (x >= 35.5 && x < 55.5) {
        return (x - 35.5) / 19.9 * 49.0 + 101.0;
    } else if (x >= 55.5 && x < 150.5) {
        return (x - 55.5) / 94.9 * 49.0 + 151.0;
    } else if (x >= 150.5 && x < 250.5) {
        return (x - 150.5) / 99.9 * 99.0 + 201.0;
    } else if (x >= 250.5 && x < 350.5) {
        return (x - 250.5) / 99.9 * 99.0 + 301.0;
    } else if (x >= 350.5 && x < 500.5) {
        return (x - 350.5) / 149.9 * 99.0 + 401.0;
    } else if (x >= 500.5 && x < 99999.9) {
        return (x - 500.5) / 99499.4 * 498.0 + 501.0;
    }
    return -1.0; // error
}
Why are PurpleAir AQI higher compared to official EPA AQI?
PurpleAir sensors overcount PM2.5 particles. To correct for this, the PurpleAir map does allow you to apply a correction to get closer to EPA monitors, before converting to AQI, but it’s not enabled by default. To activate the correction, use the Apply Conversion dropdown to select US EPA.
To understand this process further, see the Plantower correction section.
Why are Puget Sound Clean Air AQI different from official EPA AQI?
To understand this further, see LRAPA Correction.
Are the Plantower particle counters accurate? If not, how do you correct them?
EPA Correction
from EPA CEMM
The EPA Air Quality System (AQS) Federal Reference Standard (FRS) monitors use complex inertial particle size separators, PTFE filters, and humidity conditioning.
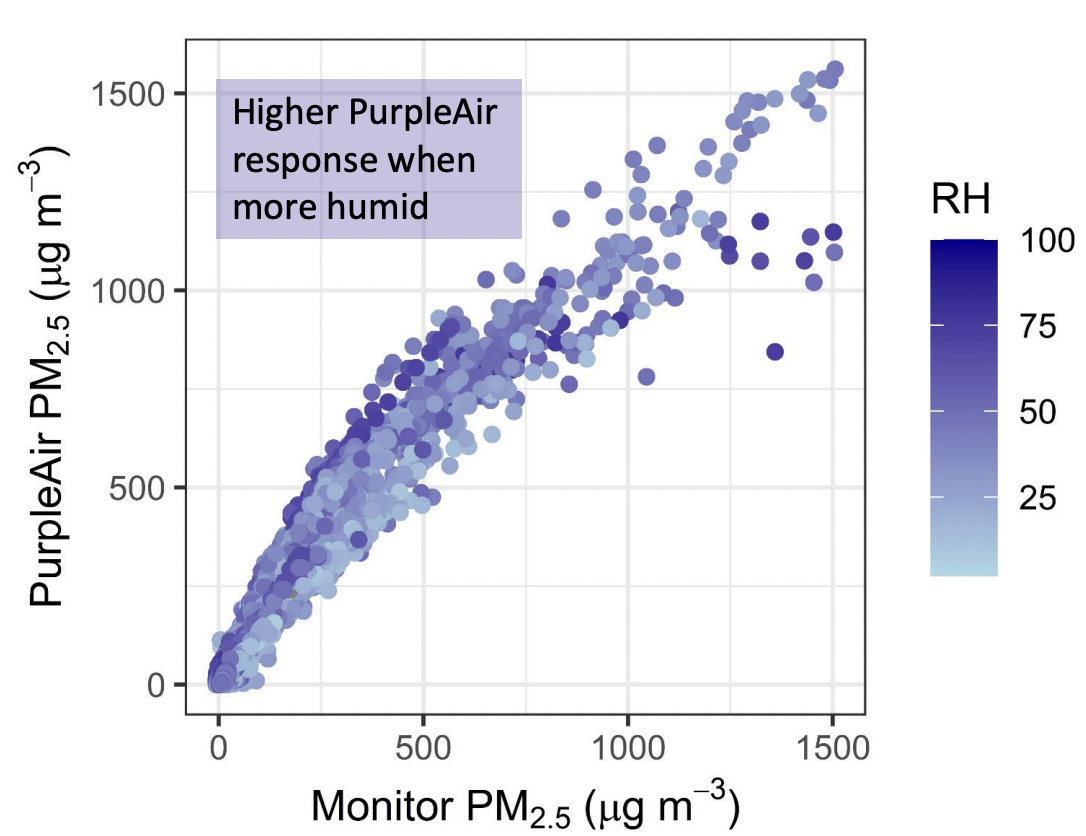
In contrast, the popular inexpensive Plantower PMSx003 counters just measure the scattering of a laser beam. This process overcount PM2.5 particles by a factor of 2 at low concentrations, and less than a factor of 2 at high concentrations, with a downward quadratic curve; the level of overcount is also influenced by humidity.
A few attempts have been made to try to correct PMSx003 counts to EPA standard, with the most recent and most authoritative multi-year effort completed by the US EPA in Oct 2021. It is a piecewise function that also takes into account the relative humidity (in %):
$$\begin{cases} PM_{2.5} = 0.52 \times PA_{\text{CF=1}} - 0.086 \times RH + 5.75, & \quad PM_{\text{CF=1}} \leq 343.0 \\ PM_{2.5} = 0.46 \times PA_{\text{CF=1}} - 3.93 \times 10^{-4} \times PA_{\text{CF=1}}^2 + 2.97, & \quad PM_{\text{CF=1}} \gt 343.0 \end{cases}$$
To understand more about the “CF=1” above, see the section on the different PM values.
For your convenience, here is my C snippet that corrects μg/m3 (PMSx003 CF=1) to μg/m3 (EPA reference):
float calibPMSx003_cf1(float x, float rh) {
	// note: besides raw value x for "cf=1",
	// also require humidity rh in %
    if (x <= 343.0) {
        return 0.52*x - 0.086*rh + 5.75;
    }
    // else: x > 343.0
    return 0.46*x + (3.93e-4)*x*x + 2.97;
}
LRAPA Correction
An earlier correction attempt, performed by the Lane Regional Air Protection Agency (LRAPA), provides similar results to the EPA correction at low concentrations, but at high concentrations overcorrects counts too low without the second quadratic piece. It also neglects the effects of humidity.
As such, the EPA correction is more authoritative and should be used instead in most instances, but note that some agencies (e.g. Puget Sound Clean Air) apply the LRAPA correction as of 2022, so you may notice differences from the EPA map as a result.
The World Air Quality Index does not apply a correction as of 2022, which will overestimate AQI in all PurpleAir sites.
What are the different PM values coming out of a PMx003?
Note that the PMSx003 outputs two separate values (pg. 13) for all PM sizes every second. Most likely, the manufacturer calibrated units with a standard test particle, and then tried to correct towards real life, non-homogenous particle counts with a piecewise linear correction of their own making, forming two separate datapoints.
For PM2.5 specifically:
| Data type | bytes [32] | ESPHome variable |
|---|---|---|
CF=1, “Standard Particle” |
6:8 |
pm_2_5_std |
atm, “atmospheric environment” |
12:14 |
pm_2_5 |
The EPA study determined that the CF=1 “Standard Particle” data was more correctable to the EPA standard instrument values. Whenever possible, apply the EPA correction to the CF=1 data value.